Response
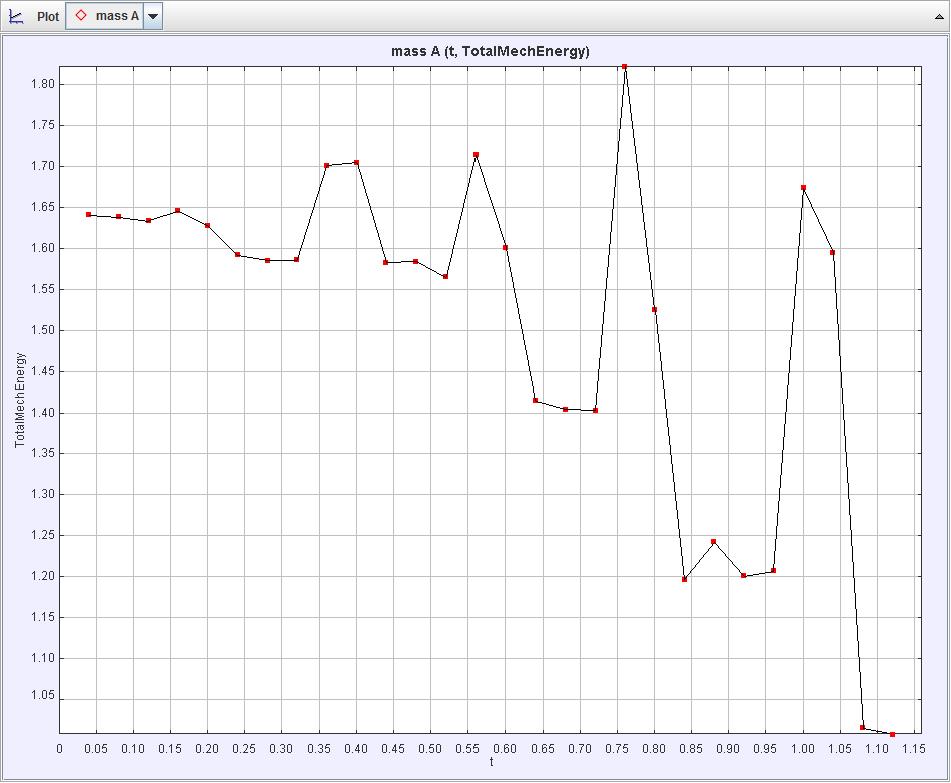
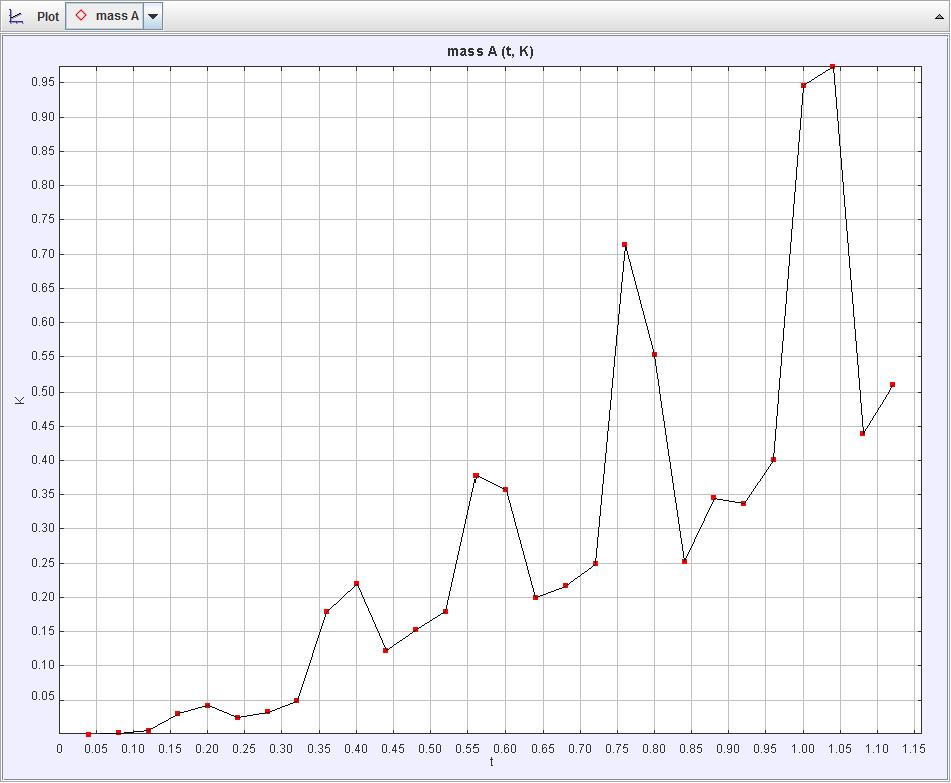
As height increases, the overall total mechanical energy has a more drastic decrease. To calculate total mechanical energy, kinetic energy was added to potential energy in Tracker. If this was setup in a "friction-less" environment, then kinetic energy and potential energy would be the only types of energy that would affect the system and the total mechanical energy graph would be a linear horizontal line for both. Kinetic Energy shows a general positive correlation because the equation for Kinetic Energy is
|
KE = (1/2) * (m) * (v^2)
|
KE - Kinetic Energy
m - mass v - velocity |
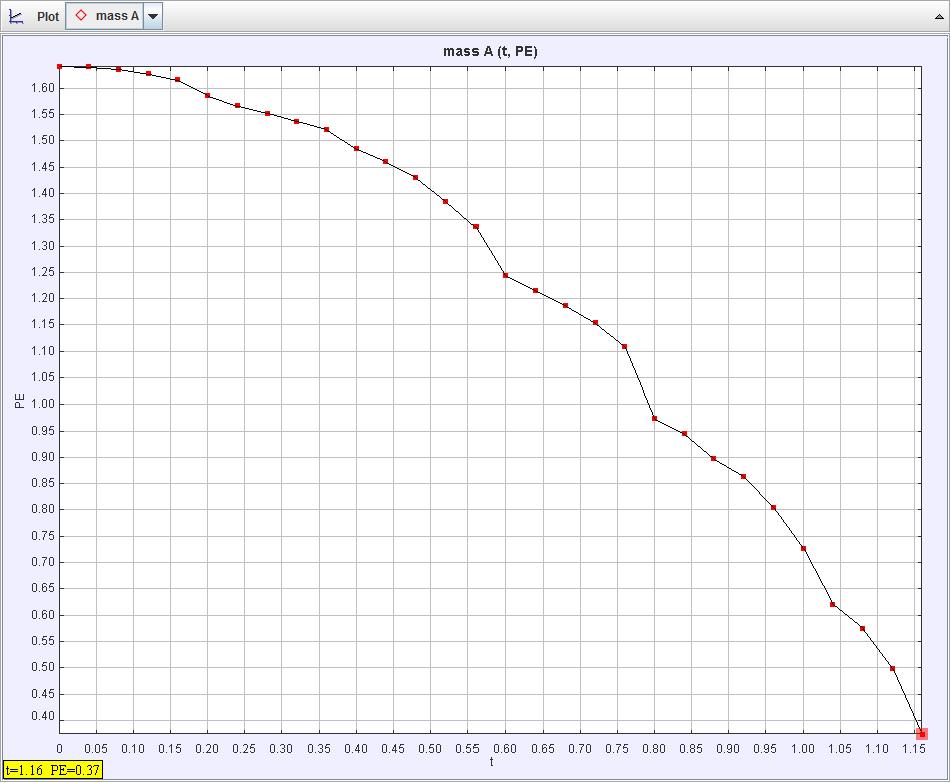
and as the cart rolls down the ramp the velocity increases. Potential Energy shows a general negative correlation because the equation for Potential Energy is
|
PE = (m)*(g)*(h)
|
PE - Potential Energy
m - mass g - gravity h - height |
and as the cart rolls down the ramp the height decreases which is why the line of the graph goes downwards. Since, the graph shows a curve for a decrease, this means there was something that affected the overall system. I think heat and sound energy are part of the reason why the total mechanical energy decreases. In conclusion, the factors that account for the loss in total mechanical energy, may be sound energy create by the cart rolling down the ramp and heat energy caused by the friction of the soup can rolling down the ramp.
|
|
|
(Total Mechanical Energy Graph, Kinetic Energy Graph, Potential Energy Graph for Height of 5 Books)
