Kinematics
A 500 g mass is being pulled up and down repeatedly by a spring. This is known as an oscillation. As time continues on, the length of the drop will decrease and eventually will come to a stop as the motion decreases.
|
Spring Constant
K= (4π²m)/T² K= (4xπ²x0.5 kilograms)/(0.80)²seconds K= 19.7 kilograms/ 0.64 seconds² Spring Constant = 30.8 N/M |
K = Spring Constant
m = mass T = seconds |
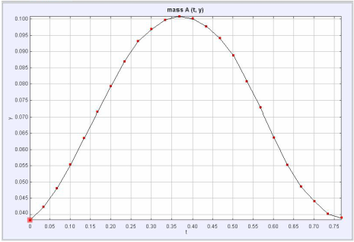
Figure 1.1
Y-Position vs. Time A period, which is one cycle, can begin from any point as long as it concludes at the same point. All of the graphs display data relative to the y-axis/height of the object. The position vs time graph proves that the object is oscillating because the height decreases and then increases again within a period. At the peak of this graph, the mass it at its lowest point. |
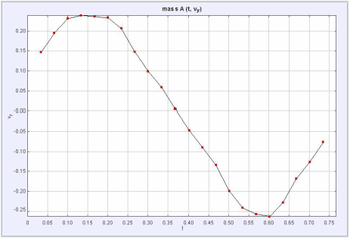
Figure 1.2
Velocity vs. Time The velocity increases as the spring mass moves up, then rapidly decreases as the mass reaches its highest point and falls back down due to gravity. This motion of moving up and then down is also known as a period |
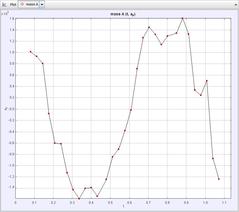
Figure 1.3
Acceleration vs. Time The acceleration quickly decreases as the spring mass goes up, and increases as the mass goes back down. As the mass nears its highest position, it slows down, which shows us that the acceleration. |
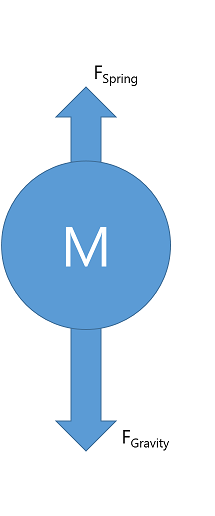
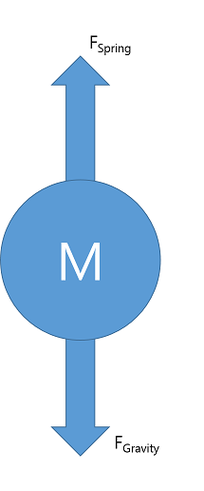
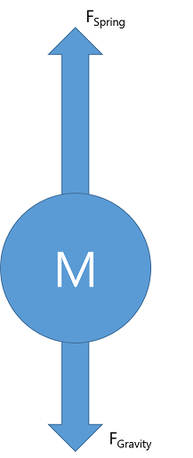
forces
There are many forces acting on the object. One such source is gravity. The constant for gravity is 9.8 m/c2. The force resisting gravity is spring tension. The object causing this spring tension is a spring hence the name spring tension. The swaying force that was acted upon the object was a slight pushed that was caused when the mass was let go by a hand. Force can be showed by Force vs. Time which is Figure 1.4.
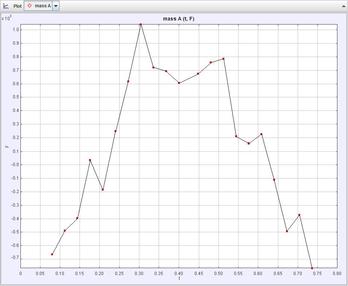
Figure 1.4
Force vs. Time
The free-body diagram's resembled in the graph, because it shows the acceleration changing throughout the graph. At the two lowest points on the graph, the mass is its lowest points. At the peak on the graph, the mass is at its highest point.
Force vs. Time
The free-body diagram's resembled in the graph, because it shows the acceleration changing throughout the graph. At the two lowest points on the graph, the mass is its lowest points. At the peak on the graph, the mass is at its highest point.
F = ma
F = 0.5 kg * -1.7 F = -0.85 N Ftotal = Fspring - Fgravity Fspring = Ftotal + Fgravity Gravity Fgravity = m * g Fgravity = 0.5 * 9.8 Fgravity = 4.9 N Spring Fspring = -0.85 + 4.9 Fspring = 4.05 N |
F = ma
F = 0.5 kg * 0.0 F = 0 N Ftotal = Fspring - Fgravity Fspring = Ftotal + Fgravity Gravity Fgravity = m * g Fgravity = 0.5 * 9.8 Fgravity = 4.9 N Spring Fspring = 4.9 N |
F= ma
F= 0.5 kg * 1.5 F= 0.75 N Ftotal = Fspring - Fgravity Fspring = Ftotal + Fgravity Gravity Fgravity = m * g Fgravity = 0.5 * 9.8 Fgravity = 4.9 N Spring Fspring = 0.75 + 4.9 Fspring = 5.65 N |
Energy
The kinetic energy of the motion starts of at 0 as shown by Figure and it rapidly reaches a peak and then is goes back down and the back to a peak and then is decreases back to 0 during one period (approx. 0.8 sec). The potential energy of the motion starts off at a high potential energy and then it decreases until it reaches a minimum and then it goes back to a max close to the first point where it starts off but from the graph you can tell there is a loss in energy from the beginning. Total energy can be calculated by finding the sum of potential and kinetic energy. Total energy can be shown by Figure which is below to the right.
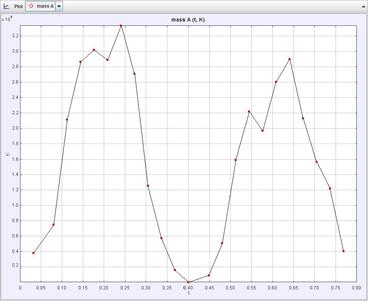
Figure 1.5
Kinetics Energy vs. Time Graph Kinetic energy is huge factor in this lab. Kinetic energy shown by this graph reaches its peak point at about 0.25 seconds and 0.45 meaning at those times in the motion, that's when kinetic energy is the most. At the two peaks of this graph |
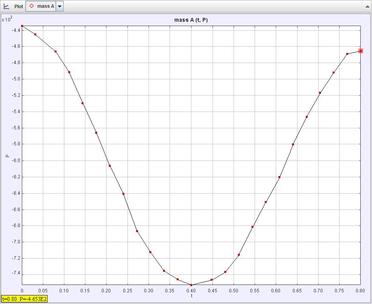
Figure 1.6
Potential Energy vs. Time Graph Potential energy is the stored energy possessed by an object. The potential energy is highest when the object is at the highest point and it is the lowest when the object is at its lowest point. |
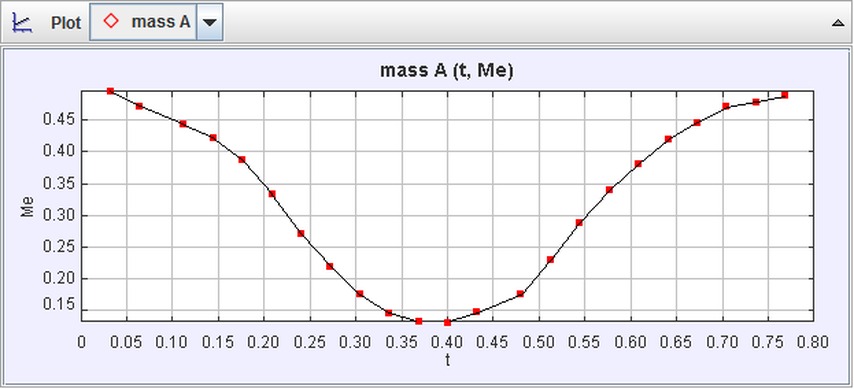
Figure 1.7
Mechanical Energy vs. Time Mechanical energy is energy of an object relative to its motion or position. Mechanical energy is directly proportional to potential and kinetic energy. As you can tell it is not a straight line, meaning that the mass has lost energy that is not in the form of kinetic or potential energy. |
|
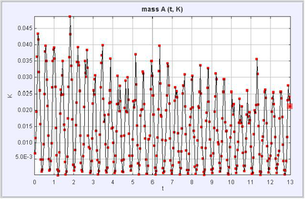
Figure 1.8
Total Kinetic Energy vs. Time The Kinetic energy goes up and then goes down and this repeats throughout the entire motion. As shown by the graph, the peaks decrease over time due to the conversion of energy. |
